Scaling light to the limiting factor
Light sets the demand; CO₂, water, airflow, feed, and heat-removal have to supply it. This paper shows you how to calculate which supply system runs out first, how to read that number as your real light ceiling, and what to upgrade if you want to go higher.
Purpose and scope
Borderline: High-rung EC and runoff ladders are advanced steering territory. Ambient CO₂ lowers marginal efficiency at high PPFD; no study supports a universal 800 µmol canopy ceiling. Size HVAC and water from your meters, not from a single ladder cell.
Photosynthesis runs at the speed of whatever is in shortest supply. Light can be the thing that sets the pace, but only up to the point where something else runs out. Past that point, more light does nothing except make heat and stress the plant.
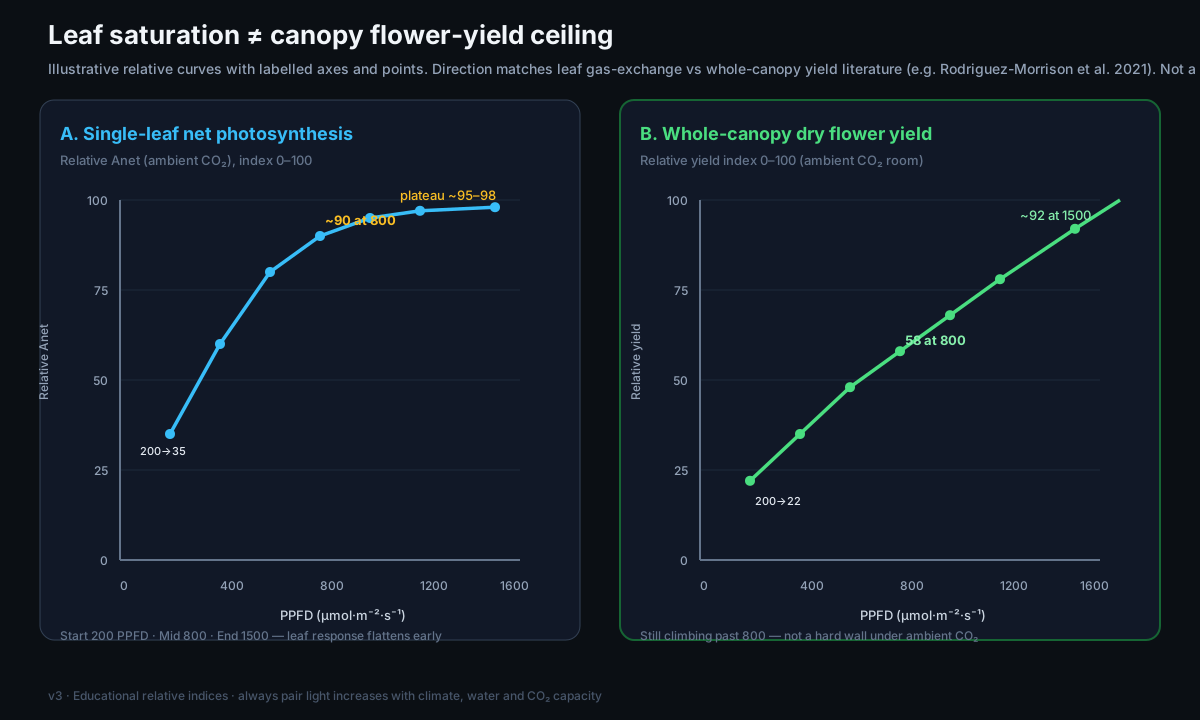
This is an old rule with two names. Liebig's law of the minimum says a crop grows at the rate set by its scarcest resource, no matter how abundant everything else is. Blackman's law of limiting factors says the same about the moment-to-moment rate of photosynthesis: raise the input that is currently limiting and the rate climbs; raise anything else and nothing happens. Rodriguez-Morrison et al. measured a linear yield increase to 1,800 µmol under ambient CO₂[1]. Leaf measurements show that CO₂, light and temperature interact, but they do not establish an 800 µmol canopy ceiling[2]. A room at 1,500 µmol on ambient CO₂ may be inefficient or stress a sensitive cultivar, so judge it from crop response and yield per kWh.
Calculate which system tops out first, then raise that ceiling or set the light below it. The companion paper Grow-room systems makes the case that the room is one machine; this paper puts numbers on it and shows you how to find the machine's weakest link.
Light is a demand you create. CO₂, water, feed, airflow and heat-removal are the supply. Yield tracks light only while every supply line keeps up, the first one that can't is your real ceiling.
Definitions
Six terms carry the rest of the guide. If these are already second nature, skip to the ladder.
Evidence and limitations
We've gone to great lengths to keep these guides honest. One of the main ways we do that is self-review: we actively look for claims that are subjective, only lightly backed by literature, or based on grower practice rather than a controlled study — and we call those out instead of dressing them up as settled science.
Often there simply is no paper for the decision you're making. In those cases we're drawing on what other growers report and what has worked in our own rooms. That can still be useful — but it is not a lab proof. Do what works for your plants, your room, and your meters. If a table disagrees with your crop, believe the crop and log the difference.
- Raising PPFD raises demand for water, nutrients, cooling, and often CO₂
- Canopy yield can keep rising past single-leaf saturation points
- Ladder tables as engineering sizing guides under strong control
- Extreme runoff EC / feed ladders as beginner defaults
- Simple PPFD × constant water-use formulas without VPD/LAI/CO₂ context
See something glaringly wrong? Tell us and we'll fix it. Please open a GitHub issue with the paper name and what looks off (include a source if you have one): Report an accuracy issue. Local law, labels, and licences always override any recipe here. Inline notes labelled grain of salt flag the highest-risk over-trust points in the text.
Light-scaling sequence
Here is the whole system on two tables, rung by rung. Pick your light level on the left and read across: everything in that row has to be true at the same time, or the light in that row is a lie. The rungs run from an ambient-CO₂ room (600 µmol) up to a fully-supported sealed room (1500 µmol).
The first table is the air and gas side of the row, what the plant breathes and the climate it sits in.
| Light (PPFD) | DLI | CO₂ setpoint | Day air temp | VPD (RH) | Canopy airspeed | Verdict |
|---|---|---|---|---|---|---|
| 600 | 26 | 400–450 ppm | 25 °C | 1.2 kPa (62%) | 0.3–0.5 m/s | Ambient air is fine |
| 800 | 35 | 600–800 ppm | 26 °C | 1.3 kPa (62%) | 0.4–0.6 m/s | Enrichment starts paying |
| 1000 | 43 | 800–1000 ppm | 27 °C | 1.3 kPa (63%) | 0.5–0.7 m/s | CO₂ now required |
| 1200 | 52 | 1000–1200 ppm | 28 °C | 1.4 kPa (63%) | 0.6–0.8 m/s | Heavy support |
| 1500 | 65 | 1200–1500 ppm | 29–30 °C | 1.4 kPa (65%) | 0.7–1.0 m/s | Everything maxed |
| VPD barely moves. It is a plant-comfort setpoint, not something that scales with light. What scales is the water you add and remove to hold that VPD while transpiration climbs (Table 2). Temp is nudged up because CO₂ and warmth lift the light-saturation point together. | ||||||
The second table is the water, feed and heat side of the same row, what you have to pour in and pull out to sustain it. This is where the cost of high light lives.
| Light (PPFD) | Transpiration (water out) | Irrigation (water in) | Feed EC | Light heat | Sensible cooling | Dehumidification |
|---|---|---|---|---|---|---|
| 600 | 2.2 L/m²/d | 3.0 L/m²/d | 2.0–2.4 | 222 W/m² | 2.1 kW /10 m² (0.6 ton) | 2.2 L/m²/d (4.7 pt) |
| 800 | 3.0 L/m²/d | 4.0 L/m²/d | 2.4–2.8 | 296 W/m² | 2.8 kW /10 m² (0.8 ton) | 3.0 L/m²/d (6.3 pt) |
| 1000 | 3.7 L/m²/d | 4.9 L/m²/d | 2.8–3.2 | 370 W/m² | 3.9 kW /10 m² (1.1 ton) | 3.7 L/m²/d (7.8 pt) |
| 1200 | 4.4 L/m²/d | 5.9 L/m²/d | 3.2–3.6 | 444 W/m² | 4.6 kW /10 m² (1.3 ton) | 4.4 L/m²/d (9.4 pt) |
| 1500 | 5.6 L/m²/d | 7.4 L/m²/d | 2.4–3.2 (advanced: up to ~3.6) | 556 W/m² | 5.6 kW /10 m² (1.6 ton) | 5.6 L/m²/d (11.7 pt) |
| Rules used: transpiration ≈ PPFD × 0.0037 L/m²/d; irrigation = transpiration ÷ 0.75; light heat = PPFD ÷ 2.7; dehu load = transpiration (1 L ≈ 2.1 US pints)[4]. Heavy CO₂ trims transpiration a little at the top. On HPS or 2.0 µmol/J LED, add ~35% to every heat, cooling and airflow figure. | ||||||
Read the two tables together and the shape of the problem jumps out. Going from 600 to 1500 µmol is 2.5× the light, but also 2.5× the transpiration, feed and heat. And because you now raise both feed EC and irrigation volume, the actual nutrient you push through the plant each day climbs roughly five-fold, not 2.5-fold. High-light plants are not a bit hungrier. They are dramatically hungrier, wetter and hotter, all at once.
Light-scaling example: a 50 m² flowering room
Per-m² numbers are abstract, so put them in a real box. Take a 50 m² flowering canopy, a 10 m × 5 m room, roughly 35 × 650 W fixtures, about 150 m³ of air. Multiply the ladder through and you get the actual gear list.
| Light (PPFD) | Fixture load | Sensible cooling | Air-handler airflow | Dehumidification | Irrigation | CO₂ to hold |
|---|---|---|---|---|---|---|
| 600 | 11.1 kW | 10.9 kW (3.1 ton) | ~2,100 m³/h (1,250 CFM) | 111 L/day (235 pt) | 148 L/day | ambient |
| 800 | 14.8 kW | 14.8 kW (4.2 ton) | ~2,850 m³/h (1,680 CFM) | 148 L/day (313 pt) | 197 L/day | ~700 ppm |
| 1000 | 18.5 kW | 18.6 kW (5.3 ton) | ~3,600 m³/h (2,120 CFM) | 185 L/day (391 pt) | 247 L/day | ~1000 ppm |
| 1200 | 22.2 kW | 22.2 kW (6.3 ton) | ~4,280 m³/h (2,520 CFM) | 222 L/day (469 pt) | 296 L/day | ~1200 ppm |
| 1500 | 27.8 kW | 27.8 kW (7.9 ton) | ~5,370 m³/h (3,160 CFM) | 278 L/day (587 pt) | 370 L/day | ~1400 ppm |
| Sensible cooling covers the fixtures only, add the dehumidifier's reject heat and pumps in a sealed room. Air-handler airflow at ~680 m³/h per cooling ton (400 CFM/ton; 1 cooling ton = 3.5 kW) is separate from the in-canopy fans that keep 0.5–1.0 m/s moving through the leaves. First CO₂ charge of a sealed 150 m³ room to 1000 ppm is only ~90 L of gas; daily burn depends mostly on how well the room seals. | ||||||
Notice the last two columns between 1000 and 1500 µmol. The fixtures rise 50%, but dehumidification jumps from 185 L/day to 278 L/day (391 to 587 pints), two grow dehumidifiers to three, and cooling goes from about 18.6 kW to 27.8 kW (5.3 to 7.9 tons). The photons are the cheap part. The cooling load and the water removal are where the money and the failures live, and they are almost always what caps a real room before the lights do.
EC management under high light
The feed column deserves its own look, because raising EC with light is the step growers most often skip, and the one that quietly caps yield. The logic is mass flow: brighter light means faster growth, which means the plant pulls more nutrient every day. It gets that nutrient two ways at once, and both scale with light, more water moves through the plant (Table 2's transpiration column)[4], and each millilitre of that water carries more salt (higher EC). Under-feed a bright canopy and it fades from the bottom up; the light is there but the raw material isn't.
| Light (PPFD) | Feed EC (mS/cm) | Target runoff EC | Daily feed per m² | Shot strategy | If you get it wrong |
|---|---|---|---|---|---|
| 600 | 2.0–2.4 | 3–4 | ~3.0 L | Fewer, larger shots; wider dryback | Under: slow, pale new growth |
| 800 | 2.4–2.8 | 4–5 | ~4.0 L | Build shot frequency with canopy | Balanced feed shows here |
| 1000 | 2.8–3.2 | 5–6 | ~4.9 L | Multiple shots, tighter window | Under: lower-canopy fade |
| 1200 | 3.2–3.6 | 6–7 | ~5.9 L | Frequent shots, watch runoff EC | Over: tip burn, crispy margins |
| 1500 | 2.4–3.2 (advanced: up to ~3.6) | advanced if runoff >> feed | ~7.4 L | High frequency + volume, daily EC checks | Either error bites fast |
| Assumes a clean source (<0.4 EC), a balanced high-ratio nutrient and an inert substrate. Coir buffers cations, so run the lower half of each band. See Coco & crop steering and Nutrient deficiencies. Raise EC as a lever after irrigation volume is right, never instead of it. | |||||
There is a second reason EC and light move together: EC is also a steering lever. When you raise the salt concentration in the solution surrounding the roots, you make it harder for the roots to pull water in — a higher salt concentration outside the root resists inward flow the same way rubbing salt onto a cucumber slice draws the moisture out rather than letting it flow in. That resistance is osmotic pressure. A higher root-zone EC raises osmotic pressure and gently throttles water uptake, slowing vegetative growth and pushing the plant toward reproductive mode — useful in flower. So at high light you raise EC for two jobs at once: to feed the faster growth, and to hold generative balance against all that extra irrigation. The trap is raising EC to steer while forgetting volume has to rise too; starve the volume and the salts simply concentrate and burn.
Identifying the limiting factor
Now the payoff. Every support system can sustain some maximum light level, a PPFD ceiling of its own. Work out the ceiling for each, and the lowest number is your room's real ceiling. Everything above it is wasted light. Here is how to turn each piece of installed gear into a PPFD number, per m² of canopy.
| System | What you have | Its PPFD ceiling |
|---|---|---|
| CO₂ | Setpoint plus measured crop response | No fixed PPFD ceiling from setpoint alone; ambient CO₂ can support yield above 800 µmol, while enrichment may improve marginal efficiency at high PPFD |
| Cooling | Installed sensible kW | PPFD ≤ 2,700 × kW ÷ m² (or 9,500 × ton ÷ m²) |
| Dehumidification | Rated L/day | PPFD ≤ 270 × L/day ÷ m² (or 128 × pints/day ÷ m²) |
| Irrigation | Max deliverable L/day | PPFD ≤ 200 × L/day ÷ m² |
| Feed / EC | Highest EC you can run | Match the EC to its rung in Table 4 |
| Airflow | Canopy air movement | A gate, not a dial, see below |
| All at LED 2.7 µmol/J; scale the cooling constant down for less efficient fixtures. Airflow gives no clean number because it is a prerequisite: if you can't hold 0.3–1.0 m/s through the whole canopy, gas exchange stalls and every other ceiling drops to roughly 900–1000 µmol. | ||
Airflow is the odd one out on purpose. Every leaf is coated in a thin, still film of air — no matter how much CO₂ is circulating in the room, CO₂ can only reach the leaf's pores by diffusing through that film. Think of it like the still water layer right against the riverbed even when the current above is fast: the layer barely moves, and things have to diffuse across it slowly. The technical name is the boundary layer. Strip it thin with airflow and CO₂ moves freely into the stomata; let it sit thick and the plant sees close to ambient CO₂ even in a 1500-ppm room. You can have 1500 ppm of CO₂ in the room and still starve the leaf if the boundary layer never gets stripped away. Dead air inside a dense canopy is a CO₂ ceiling you can't see on the room sensor. Treat airflow as a pass/fail gate you clear before reading any other ceiling.
Run the six numbers, take the minimum, and you have found the wall. The diagram makes it concrete for a real room.
Limiting-factor case studies
The same method, four common rooms. Each has plenty of everything except one thing, and that one thing is the yield. The fix is never ‘more light.’
The room: 50 m², 21 kW (6 ton) of cooling, CO₂ to 1500 ppm, good fans, two 97 L/day dehumidifiers (410 pints/day total, 194 L/day). The math: cooling ceiling 2,700×21.1÷50 ≈ 1140; dehu ceiling 270×194÷50 ≈ 1050; CO₂ ceiling 1500. The wall: dehumidification, at ~1050 µmol. The fix: run the lights at 1050, or add a third dehumidifier to unlock the 1140 the cooling already allows. Then cooling becomes the next wall.
The room: big cooling and dehu, but no CO₂ supplementation, ambient 420 ppm. The evidence: leaf efficiency falls as PPFD climbs[2], yet Rodriguez-Morrison et al. reported linear canopy yield through 1,800 µmol under ambient CO₂ in a single cultivar and room[1]. The practical limit: there is no universal 800 µmol ceiling. Track canopy temperature, bleaching, DLI and yield per kWh. Dial light down when the crop is damaged or the marginal yield no longer pays for power and climate control. Add CO₂ only after confirming that the room can carry the added heat, water and safety load.
The room: CO₂ to 1200, strong cooling and dehu, but a thick canopy with dead, laminar air in the lower half. The math: no clean number; the boundary layer isn't stripped, so CO₂ can't reach the stomata inside the canopy. Effective ceiling collapses to ~900–1000 even though the room ‘has’ 1200 ppm. The wall: airflow gate. The tell: lush outer buds, larfy damp interior. The fix: defoliate and add under-canopy air before touching the lights or the CO₂.
The room: climate and gas all support 1300, but irrigation is a couple of short shots and feed EC is stuck at 2.4. The math: the canopy wants 4.5+ L/m²/day and 3.4 EC; it's getting ~3 L and 2.4. Water ceiling 200×(deliverable L)÷m² lands near 900, and the low EC caps the same rung. The wall: irrigation volume + EC. The tell: midday wilt and a pale, fading lower canopy. The fix: get shot volume and frequency right first, then climb EC up Table 4 — not the other way round.
Setting light intensity to the limiting factor
Once you know your lowest ceiling, you have exactly two honest moves.
Move one: set the light to the wall. If your ceiling is 1050 µmol, run 1050. The photons above it were never converting to yield. They were converting to heat, humidity and stress. Dialling down to the wall costs nothing in growth and hands back power, cooling headroom and a calmer room. On dimmable fixtures this is free and immediate.
Move two: raise the wall, then re-check. Spend on the limiting system and nothing else. Adding CO₂ to a Case-B room is transformative; adding CO₂ to a Case-A room does nothing, because dehu, not CO₂, is the wall. And the part people miss: the moment you raise one ceiling, a different system becomes the wall. Fix the dehu in Case A and cooling caps you at 1140. Chase the ceiling in the wrong order and you buy gear that changes nothing.
It isn't neutral. Excess light past your limiting factor bleaches and foxtails tops, drives leaf temp and VPD up, and, when the dehu is the wall, pushes humidity into bud-rot territory. You pay for the extra electricity and lose quality. The dial-down is the rare free lunch.
There is also an economic ceiling below the biological one. Yield keeps climbing toward 1500–1800 µmol[1], but the cooling load and water removal needed to support the top rungs climb faster than the yield does. The last 300 µmol might cost a third dehumidifier and a bigger AC to buy a single-digit-percent bump. Find your economic wall, where the next 100 µmol stops paying for its own climate gear. And it often sits a rung below what the plants could theoretically use.
Troubleshooting
Every row here is a limiting factor showing itself. The symptom tells you which wall you hit.
| Symptom | Which wall you hit | What to do |
|---|---|---|
| Bleached, foxtailed tops under big light | The cultivar or canopy exceeded its tolerated PPFD, temperature or DLI | Measure canopy temperature and light distribution; lower PPFD while testing CO₂ as a separate variable |
| RH won't come down; VPD collapses midday | Transpiration outran dehumidification | Add dehu capacity or trim light, usually the real ceiling |
| Big light, flat yield | CO₂, water or feed didn't scale with the light | Find the lowest ceiling; raise it or dial light to it |
| Midday wilt at peak light | Irrigation volume < transpiration | Bigger/more shots; fix volume before touching EC |
| Pale, fading lower canopy late in flower | Feed EC too low for the light level | Step EC up Table 4; check runoff EC |
| Tip burn, crispy leaf margins | Feed EC too high for the light (above the rung) | Drop EC a step, or raise light/volume to match |
| Lush outside, larfy damp interior | Airflow gate, boundary layer not stripped inside | Defoliate + under-canopy air; CO₂ can't work in dead air |
Expected results and limitations
Cannabis yield really does track light almost linearly, up to roughly 1500–1800 µmol[1]. But that finding comes with fine print those studies never hide: it holds only when CO₂, temperature, water and feed are all lifted to match. Strip the support away and the same lights give you bleached tops and a heat problem. The linear curve is a promise conditional on the whole convoy keeping up.
So spend your attention where the wall is, not where the catalogue is. The most common real ceilings, in rough order, are dehumidification, then cooling, then CO₂, then root-zone delivery, and the cheapest yield you will ever buy is usually removing your current limiting factor, not adding another kilowatt of light. Measure the things that reveal the wall: leaf temperature, runoff EC, canopy-level RH and airspeed, room CO₂ under the canopy. A gauge at the room's edge won't show you the dead, humid air where the plant actually lives.
- Light is a demand. Size CO₂, water, feed, airflow and heat-removal to supply it (Tables 1–2).
- Turn each installed system into a PPFD ceiling; the lowest wins (Table 5).
- Set the light to that wall, running above it wastes power and costs quality.
- To go higher, raise the limiting system, then re-check, the wall moves.
This paper is one lever of the room. Read it alongside Grow-room systems, CO₂ enrichment and Airflow design.
References
- Rodriguez-Morrison V, Llewellyn D, Zheng Y (2021). Cannabis yield, potency, and leaf photosynthesis respond differently to increasing light levels in an indoor environment. Front. Plant Sci. 12:646020. https://pmc.ncbi.nlm.nih.gov/articles/PMC8144505/
- Chandra S, Lata H, Khan IA, ElSohly MA (2008). Photosynthetic response of Cannabis sativa L. to variations in photosynthetic photon flux densities, temperature and CO2 conditions. Physiol. Mol. Biol. Plants 14(4):299-306. https://pmc.ncbi.nlm.nih.gov/articles/PMC3550641/
- Faust JE, Logan J (2018). Daily light integral: a research review and high-resolution maps of the United States. HortScience 53(9):1250-1257. https://doi.org/10.21273/HORTSCI13144-18
- Collado CE, Hernandez R (2025). Vegetative and reproductive stage lighting interactions on flower yield, water-use efficiency, terpenes and cannabinoids of Cannabis sativa. Scientific Reports 15:s41598-025-27437-4. https://www.nature.com/articles/s41598-025-27437-4
Citations marked in-text as [n] map to this list. Primary literature and official guidance except where noted. Cannabis tissue culture is strongly genotype-dependent, verify dilutions, hormone doses and local regulations against the primary sources before relying on them.